At a glance: A real-time market data simulation system, built for architects and leaders. Clean layered design, sub-100ms latency, and deliberate technology choices—Redis Streams, SSE, quantitative price models—documented for clarity and reuse.
What It Is
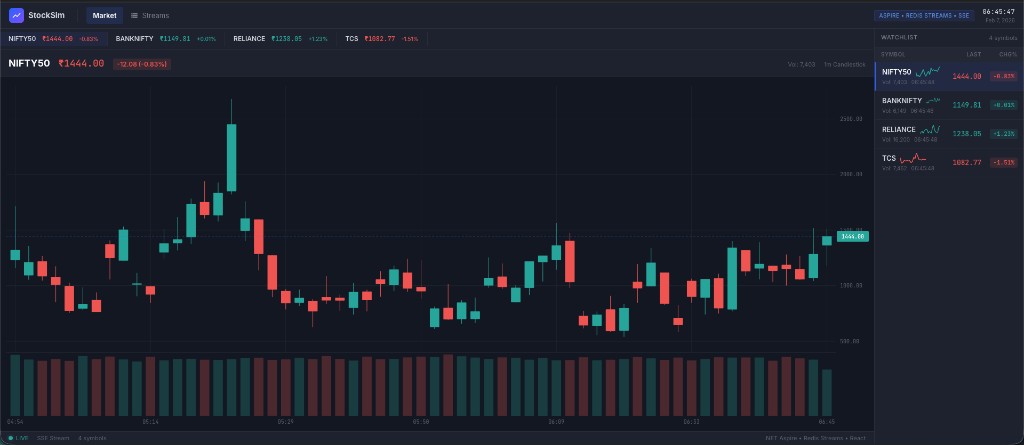
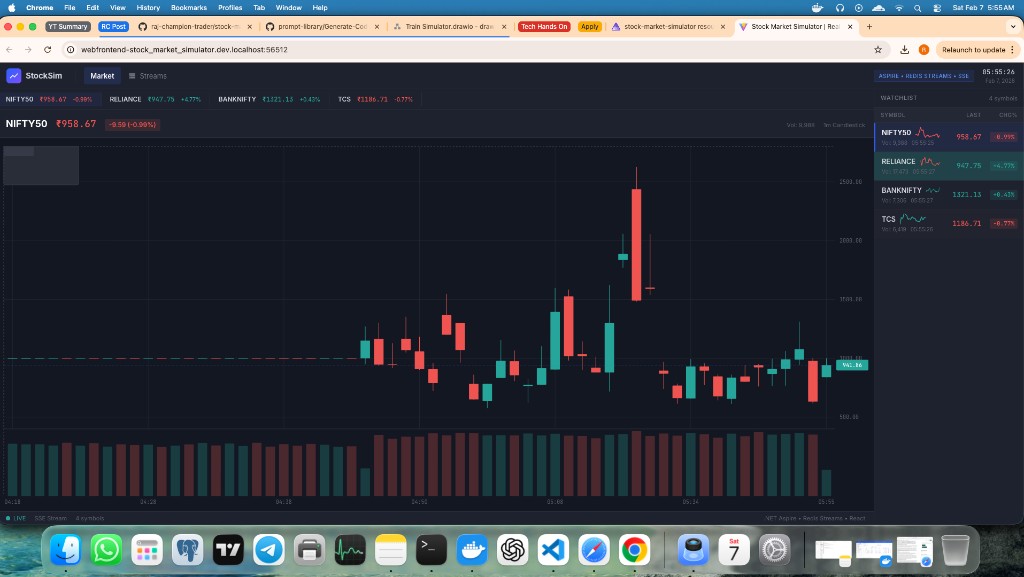
The Stock Market Simulator is a real-time market data simulation system that generates statistically realistic synthetic prices and streams them to a web UI. Four Indian symbols—NIFTY50, BANKNIFTY, RELIANCE, and TCS—are simulated with distinct volatility profiles. Data flows from a price engine through a message broker to the browser via Server-Sent Events, creating a practical reference for event-driven, low-latency architecture.
Why it matters for leadership: The system demonstrates how to achieve reliability, scalability, and observability with a small set of well-chosen patterns—consumer groups, bounded channels, event streaming—without the overhead of heavier enterprise middleware. It is documented with formal Architecture Decision Records and C4-style diagrams in the repository.
Logical Architecture
The system is organized in four logical layers: Presentation, Application, Integration & Data, and Data Source. The diagram below is the single source of truth for how capabilities are grouped and how data and control flow between them.

| Layer | Capabilities |
|---|---|
| Presentation | Trader/viewer (actor), Web frontend (React, TypeScript, D3) |
| Application | Market Ingestion API, Broker Service (SSE, aggregation), OpenTelemetry (OTLP) |
| Integration & Data | Redis Streams (message broker, consumer groups) |
| Data Source | Market Simulator (price generation: GBM, GARCH) |
How It Flows
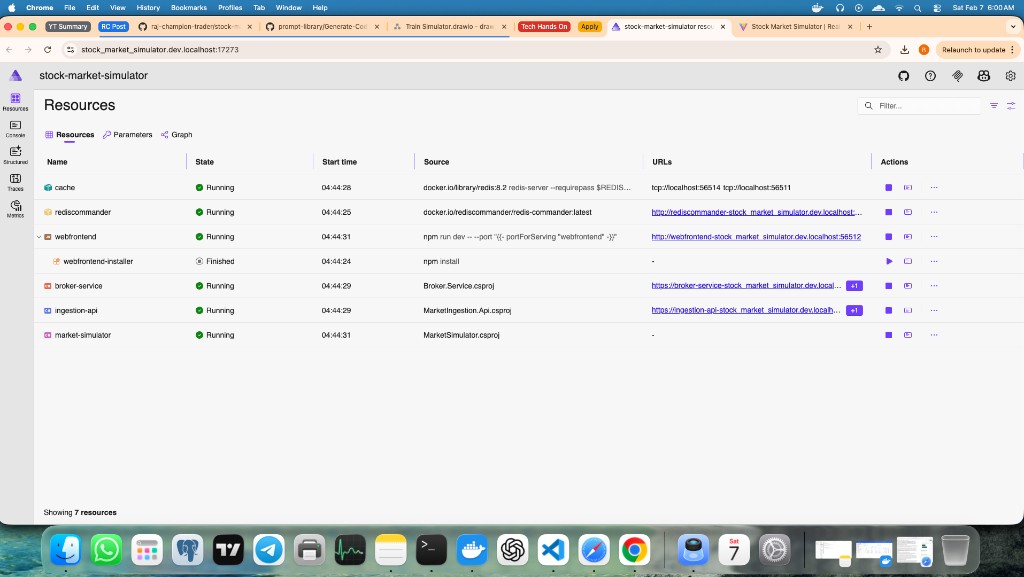
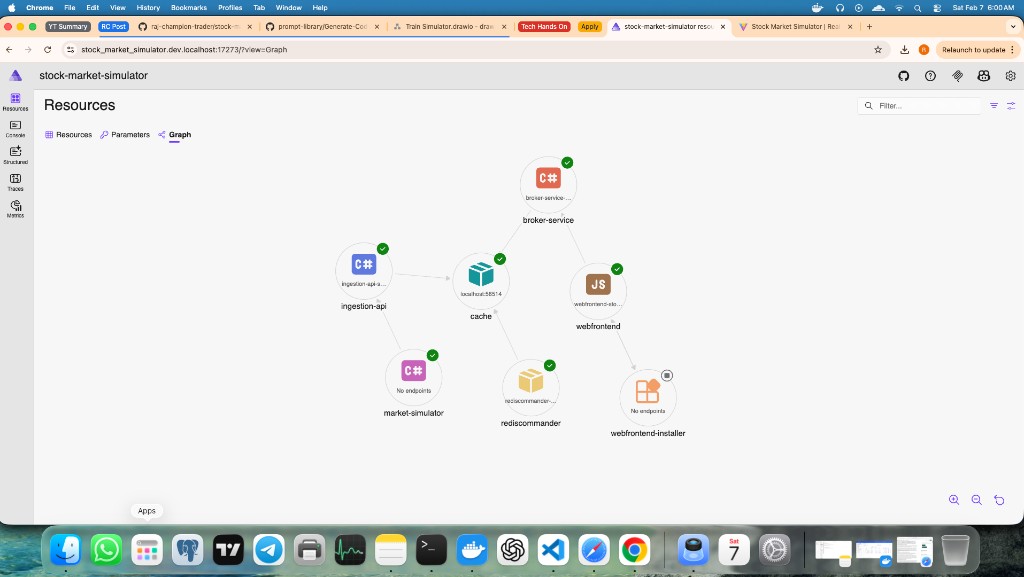
Data is generated by the Market Simulator (quantitative models), ingested and validated by the API, stored and distributed via Redis Streams, and consumed by the Broker Service, which aggregates candlesticks and streams updates to the Web Frontend over SSE. End-to-end latency is sub-100ms. Deployment is orchestrated with .NET Aspire (single dotnet run); Redis is provisioned via Docker. For detailed data-flow and sequence diagrams, see the reference docs and mermaid diagrams in the repo.

See it in action
The app runs with a single command. Below, a short tour of the working prototype—live UI, Aspire dashboard, and development setup. Auto-advances when in view; use Pause to hold on a slide.
Quality Attributes
- Performance — Sub-100ms latency; bounded channels and backpressure so slow clients do not affect others.
- Scalability — Horizontally scalable brokers using Redis consumer groups; stateless services for load balancing.
- Reliability — SSE reconnection with Last-Event-ID replay; Redis persistence; health checks and ordered startup via Aspire.
- Observability — OpenTelemetry (OTLP) across .NET services; Redis monitoring in the UI; structured logging.
- Maintainability — Clear separation of services; shared contracts; dependency injection; 10 ADRs for major decisions.
Key Architectural Decisions
The project maintains 10 formal ADRs in the repository. Summary for executives and architects:
| Decision | Rationale |
|---|---|
| Redis Streams over Kafka/RabbitMQ | Consumer groups, ordering, bounded retention, and lower operational complexity for this scale. |
| SSE over WebSockets | Server-to-client only; native reconnection and Last-Event-ID; simpler and proxy-friendly. |
| Backend candlestick aggregation | Single source of truth; consistent candle boundaries and OHLCV across all clients. |
| Custom D3.js charts | Full control and no licensing dependency; TradingView-style UX without the library. |
Deep dives, alternatives considered, and tradeoffs are in the ADR folder in the repo.
Technology Stack
| Layer | Technology |
|---|---|
| Orchestration | .NET Aspire |
| Backend | .NET 10 |
| Message broker | Redis Streams 7.x |
| Frontend | React 19, TypeScript 5.9, MUI 7, D3.js 7.9 |
| Build | Vite 7 |
| Observability | OpenTelemetry (OTLP) |
Future Directions
- Historical data replay from Redis stream history
- Technical indicators (e.g. MACD, RSI, Bollinger Bands) on charts
- Multi-timeframe aggregation (1m, 5m, 1h)
- Order book simulation and market depth
- Authentication and per-user watchlists
Conclusion
The Stock Market Simulator shows how a focused set of architecture decisions—event streaming, consumer groups, SSE, backend aggregation—yields a system that is reliable, scalable, and observable. The value for architects and leaders is in the clarity of the logical design and the documented rationale; for senior engineers, the repo provides full C4 and mermaid diagrams, ADRs, and implementation details.
“The quality of your work reflects the quality of your thinking. Build systems that think clearly.”
Detailed diagrams and ADRs: Stock Market Simulator repository — C4 model, mermaid diagrams, and Architecture Decision Records are maintained in the repo.
Last Updated: February 2026