Day 15 of Australian Rail Series
Everyone knows rail generates data. But what if the data is worth more than the infrastructure it describes — and almost nobody is mining it?
The Story
Everyone knows the rail industry generates data. Track measurement trains. IoT sensors. Inspection records. SCADA systems. GPS feeds. Weather stations. Decades of spreadsheets. The data exists. Everyone acknowledges this.
But here’s the reversal: having data and using data are entirely different accomplishments.
Most Australian rail operators are sitting on petabytes of historical and real-time information — enough to predict failures weeks in advance, optimise crew deployment, extend asset life through reliability-centred maintenance, and reduce costs by millions. And most of that data sits in disconnected silos, incompatible formats, and forgotten databases. It is, quite literally, buried treasure.
The irony is exquisite: an industry that moves physical materials more efficiently than any other mode of transport is profoundly inefficient at moving information within its own operations.
The goldmine isn’t in buying more sensors. It’s in connecting the sensors you already have.
Day 15 in pictures
A few visuals for the post.
The Deep Dive — 8 Questions
Why does a single operator managing petabytes of data still struggle to extract actionable insights?
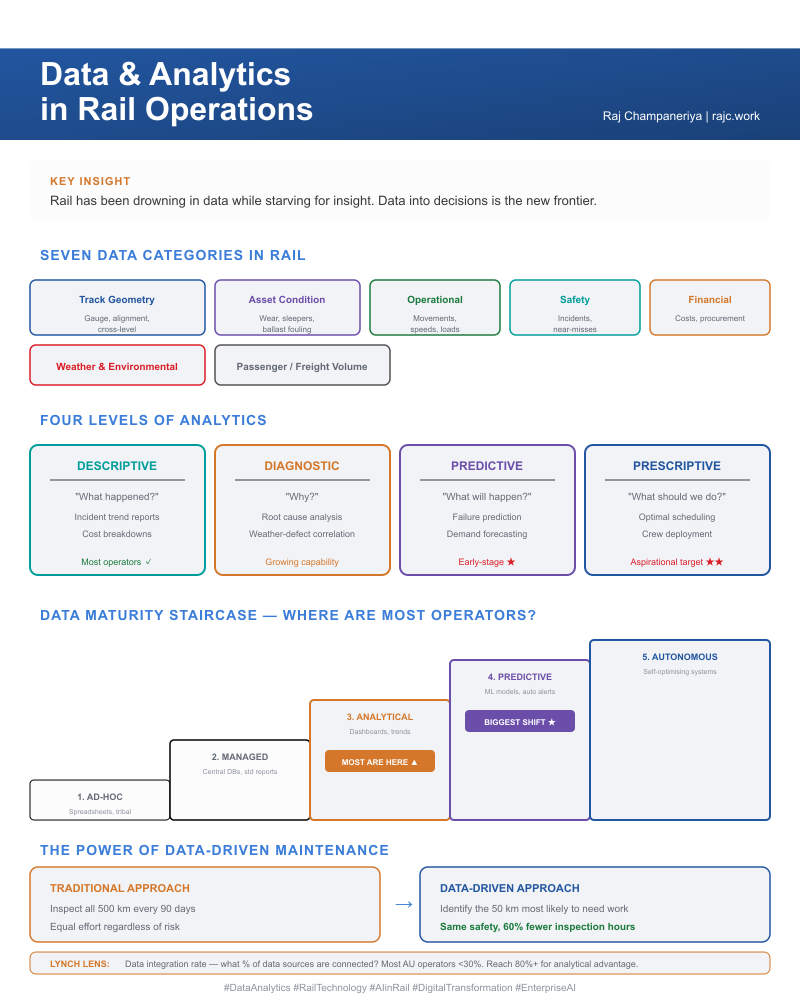
Rail generates vast and varied data:
| Data Category | Examples |
|---|---|
| Track geometry | Gauge, alignment, cross-level, twist |
| Asset condition | Rail wear, sleeper condition, ballast fouling |
| Operational | Train movements, speeds, axle loads |
| Safety | Incident reports, near-misses, audit findings |
| Financial | Maintenance costs, procurement spend, contract performance |
| Environmental | Weather, temperature, rainfall, flooding |
| Demand | Passenger volumes, freight tonnes |
A single large operator may manage petabytes across these categories. The struggle isn’t volume — it’s integration. Each category lives in a different system, was created by a different team, uses different standards, and was never designed to talk to the others.
Why is the shift from periodic manual inspections to continuous automated collection a fundamental change?
Collection methods span a spectrum:
- Manual: handheld inspection devices, visual assessments, paper-based forms
- Mechanised: track measurement trains (RailBAM, AK Cars), wayside detection systems
- Automated: IoT sensors (vibration, temperature, strain), GPS-based tracking, SCADA
- Emerging: drone-based LiDAR and photogrammetry, satellite imagery via remote sensing
The fundamental change is philosophical, not just technological. Periodic manual inspections gave operators snapshots — what the asset looked like on the day someone walked past it. Continuous automated collection gives operators movies — a living record of how every asset is behaving, all the time. The decision-making implications are profound.
Why are most Australian rail operators strong at descriptive analytics but early-stage where it matters most?
The analytics maturity ladder (adapted from Gartner’s analytics ascendancy model):
| Level | Question It Answers | Rail Example | Australian Maturity |
|---|---|---|---|
| Descriptive | “What happened?” | Incident trend reports, cost breakdowns | Strong |
| Diagnostic | “Why did it happen?” | Root cause analysis, weather-defect correlation | Growing |
| Predictive | “What will happen?” | Asset failure prediction, demand forecasting | Early-stage |
| Prescriptive | “What should we do?” | Optimal maintenance scheduling under constraints | Nascent |
The greatest value sits at the top of the ladder — predictive and prescriptive analytics that tell operators what to do next. But most operators are still climbing the lower rungs, as the Australasian Railway Association’s Digital Rail Transformation Roadmap confirms. The gap between aspiration and reality is measured not in years but in data infrastructure.
How does IBM watsonx enable rail operators to build AI applications on a single foundation?
AI and machine learning applications for rail:
- Computer vision — automated defect detection in rail and infrastructure images using convolutional neural networks
- Natural language processing — extracting insights from decades of inspector reports via large language models
- Time-series models — predicting component degradation from sensor history using recurrent neural networks
- Optimisation algorithms — scheduling maintenance under budget, crew, and possession constraints via linear programming
- Anomaly detection — identifying unusual track behaviour before failure occurs using statistical process control
IBM watsonx provides the foundation models and developer tools to build these applications on a single platform. For rail operators, this means they don’t need to assemble AI from scratch — they need to configure and train proven tools on their specific data.
How can data-driven prioritisation achieve the same safety outcomes with 60% fewer inspection hours?
Consider a practical example:
Traditional approach: Inspect all 500 km of a corridor every 90 days, as prescribed by ONRSR compliance frameworks and AS 7636 Rail Track Inspection standards. Every section receives equal attention regardless of risk.
Data-driven approach: Apply risk-based inspection methodology — analyse track geometry trends, loading patterns, weather exposure, asset age, and historical defect rates to identify the 50 km most likely to need attention. Inspect those first. Defer inspection of low-risk sections to a longer cycle.
Result: Same safety outcomes with 60% fewer inspection hours (consistent with McKinsey’s findings on advanced analytics in transport). The freed crews are redeployed to corrective work on the defects they would otherwise have discovered weeks later. The maintenance budget doesn’t change — but its allocation becomes dramatically more effective.
Why do most operators fail at data integration before they ever reach the analytics layer?
Effective data infrastructure requires:
| Component | Purpose |
|---|---|
| Data integration platforms | Connecting siloed systems — GIS, ERP, SCADA, Maximo — using ETL and data pipeline architectures |
| Cloud or hybrid storage | Handling petabyte-scale historical and real-time data via data lakehouse architectures |
| Data governance | Ensuring quality per ISO 8000 standards, consistency, access control, and security |
| Visualisation tools | Dashboards for operational managers and executives (e.g., Power BI, Tableau) |
| Analytics platforms | Tools for data scientists and domain engineers — Jupyter, Python, R |
IBM Cloud Pak for Data and watsonx.data provide the foundation for this infrastructure. But the tools aren’t the bottleneck — the cultural and organisational commitment to using integrated data for decisions is where most operators stall.
Who owns track geometry data — and why does this dispute reveal a deeper governance gap?
Data governance challenges in Australian rail:
- Ownership disputes — who owns track geometry data, the network owner or the maintenance contractor? (a common intellectual property tension in public-private partnerships)
- Data quality — inconsistent measurement standards across states and historical eras, lacking alignment with ISO 8000 data quality principles
- Integration barriers — legacy systems with proprietary formats that resist connection, compounding technical debt
- Privacy — workforce data, CCTV footage, employee location tracking under the Privacy Act 1988
- Security — operational data is a critical infrastructure asset under the SOCI Act, regulated by the Office of the National Rail Safety Regulator (ONRSR)
The ownership question is symptomatic of a deeper gap: most rail organisations don’t have mature data governance frameworks aligned with standards like DAMA-DMBOK. They know what systems they have, but not what data is in them, who’s responsible for it, or what quality standards it should meet. Until governance is solved, analytics is built on unreliable foundations.
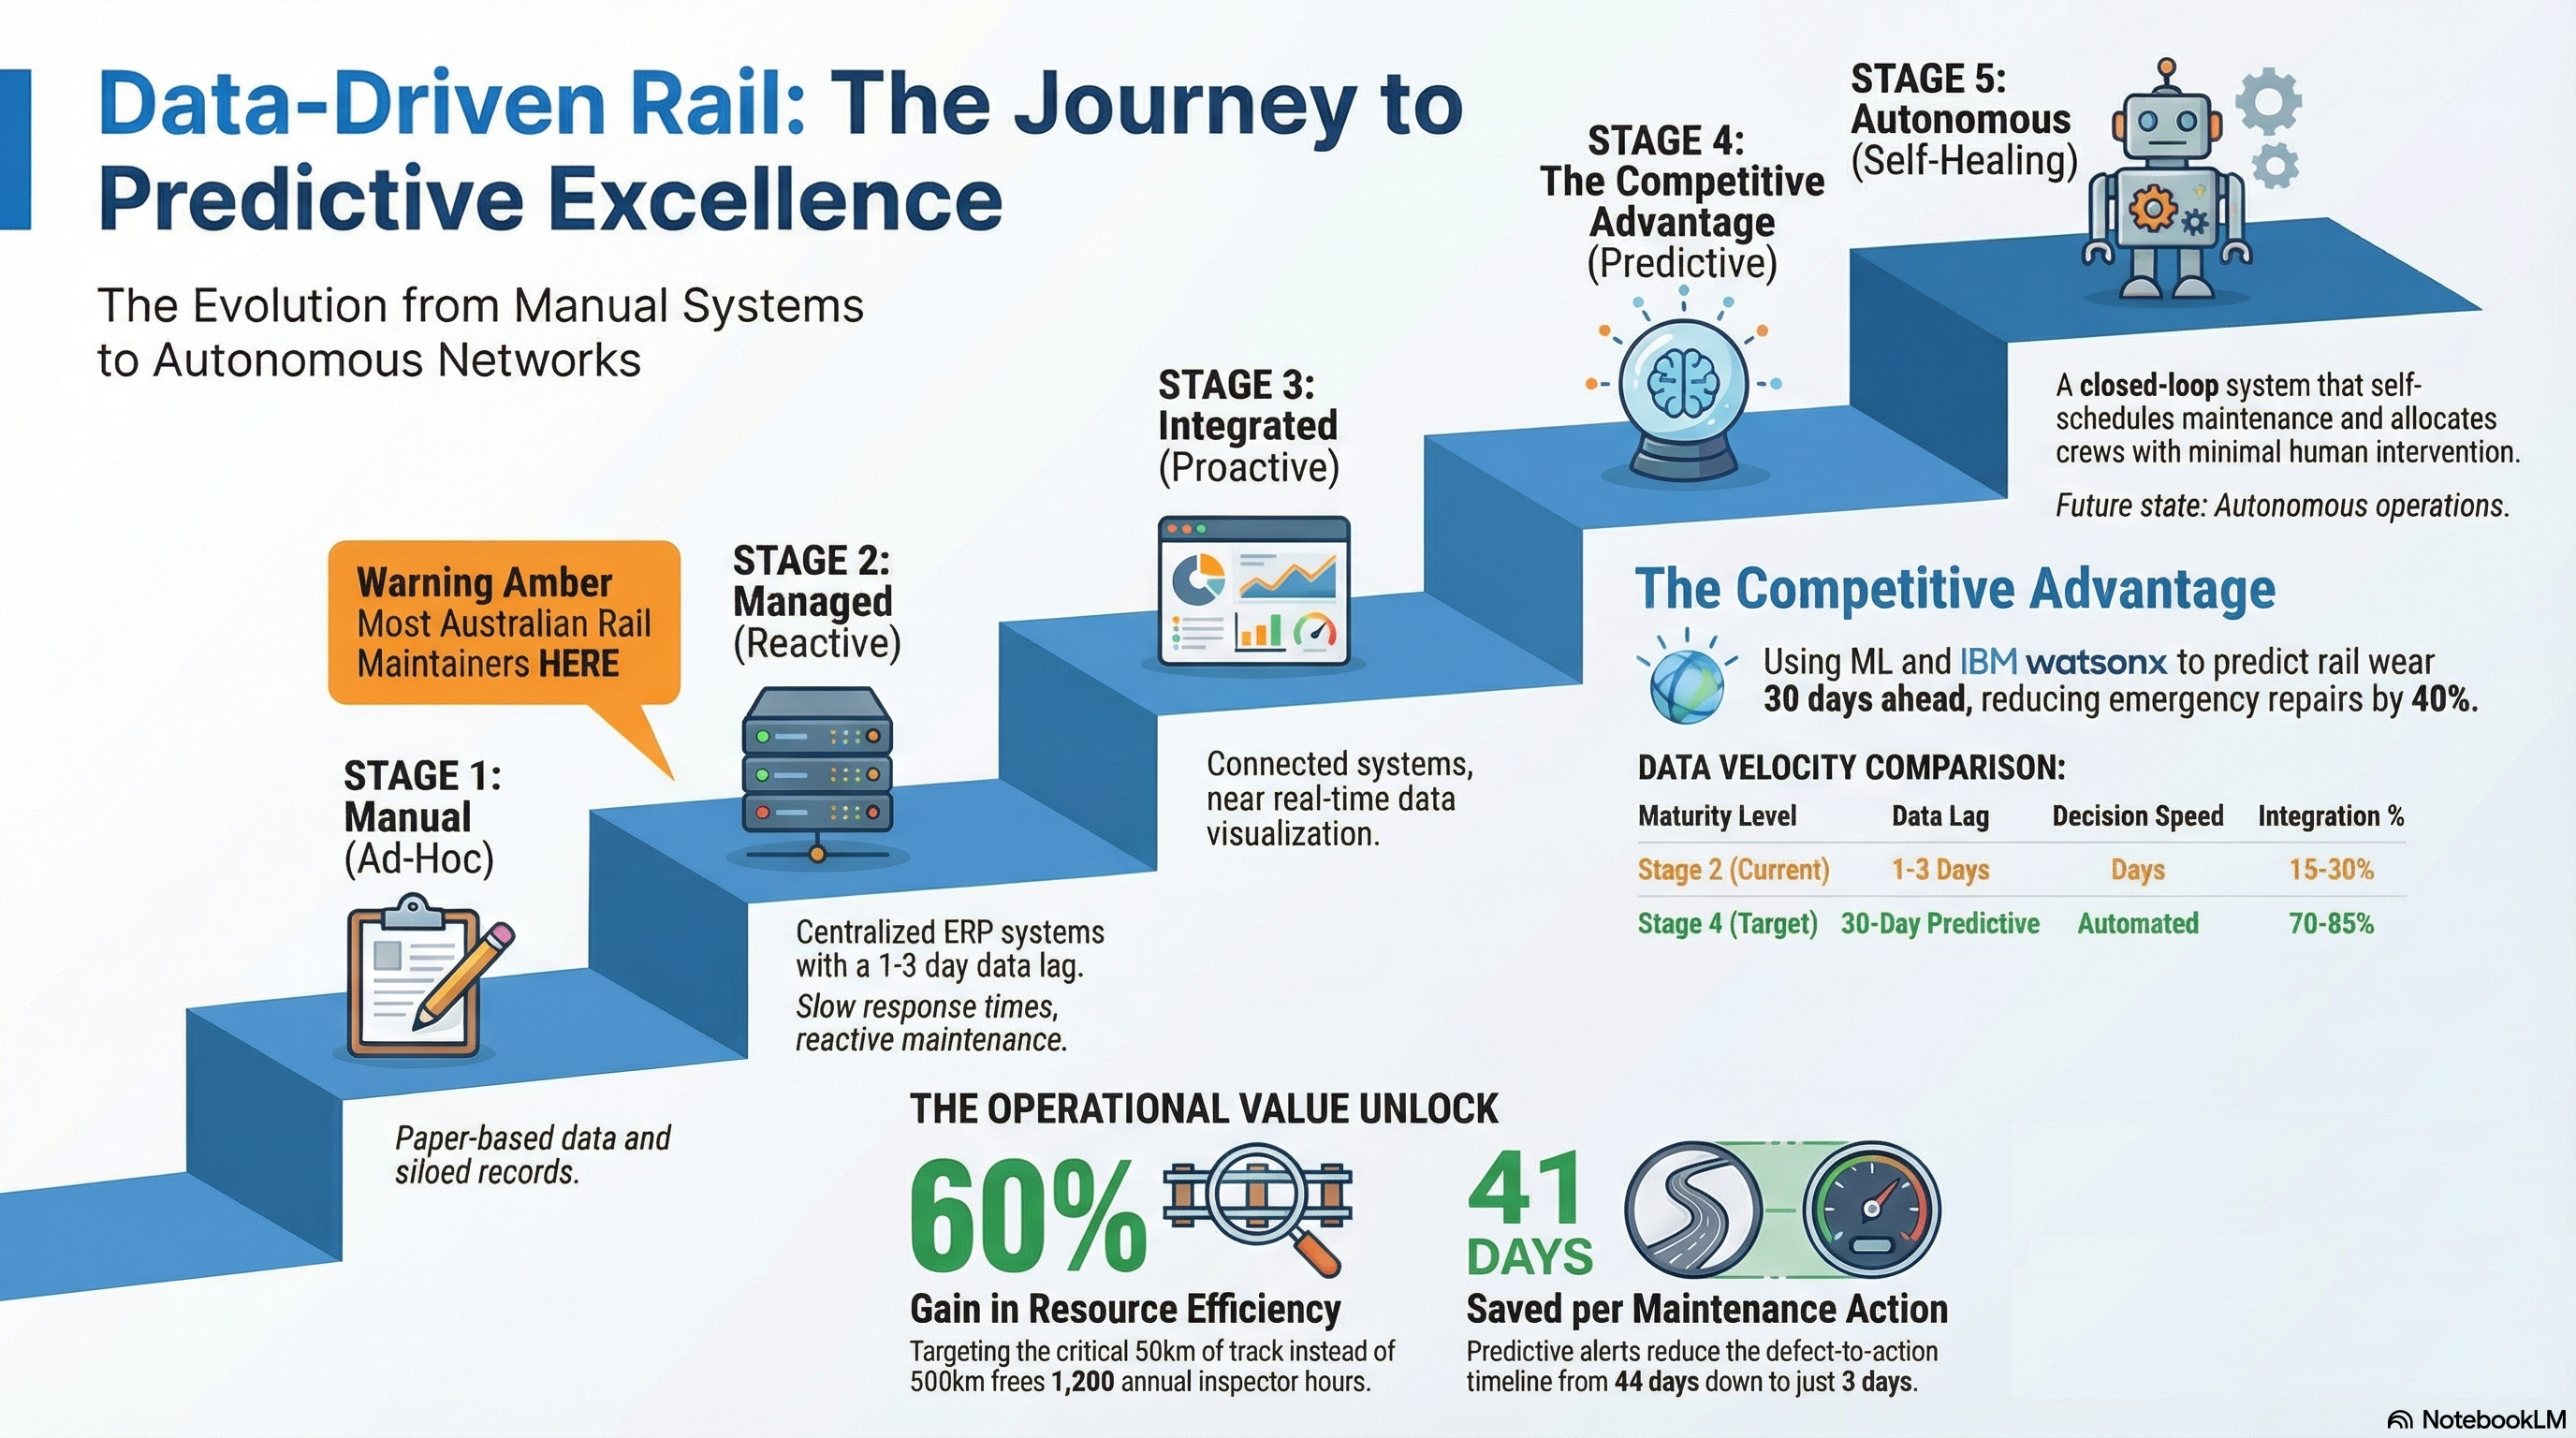
Why does the jump from Stage 3 to Stage 4 require the biggest mindset shift in rail data maturity?
Data maturity progression (based on the CMMI framework):
| Stage | Description | Decision Style |
|---|---|---|
| 1. Ad-hoc | Spreadsheets, tribal knowledge | “I’ve been doing this for 20 years” |
| 2. Managed | Centralised databases, standard reports | “The report says…” |
| 3. Analytical | Dashboards, trend analysis | “The trend shows…” |
| 4. Predictive | ML models, automated alerts | “The model predicts…” |
| 5. Autonomous | Self-optimising, closed-loop | “The system decided…” |
Most Australian rail operators are at stages 2–3, according to ARA industry assessments and BITRE benchmarking. The jump to Stage 4 is the hardest because it requires trusting a model’s prediction over a human’s intuition — a challenge well-documented in organisational change management literature. That’s not a technology upgrade. It’s a mindset transformation. The operators who make this leap will outperform their peers. Those who don’t will spend more, know less, and react slower.
Synthesis
Data and analytics represent the largest untapped efficiency lever in Australian rail maintenance. The raw data exists — decades of inspection records, millions of sensor readings, comprehensive asset registries. The gap is in integration, analysis, and action.
The connections to earlier themes are direct: digital twin and predictive maintenance capabilities (Day 11) depend entirely on the data infrastructure explored today. The workforce skills gap (Day 12) is amplified when operators lack the data literacy to use available tools. And the Week 2 synthesis showed that maturity gaps between dimensions create friction — data is the connective tissue that closes those gaps.
Organisations that connect their data silos, apply appropriate analytics (moving from descriptive to predictive), and embed data-driven decision-making into operational routines will achieve significantly better outcomes with the same or fewer resources — a pattern McKinsey estimates can deliver 10–20% cost reductions in asset-heavy industries. The data goldmine is real. The question is whether operators will invest in the picks and shovels to extract it.
Vocabulary Spotlight
| Term | Definition |
|---|---|
| Prescriptive analytics | The most advanced analytics tier, using AI and optimisation algorithms to recommend specific actions (e.g., “replace this rail segment in 14 days”) |
| Data integration | Combining data from multiple sources (track sensors, EAM systems, weather feeds) into a unified dataset for analysis |
| Data maturity | An organisation’s capability level in collecting, managing, analysing, and acting on data — commonly assessed using the CMMI framework |
| Risk-based inspection | Prioritising inspection effort based on statistical likelihood of failure rather than fixed schedules |
| ETL | Extract, Transform, Load — the process of moving data from source systems into analytics platforms |
| DAMA-DMBOK | The Data Management Body of Knowledge — an industry-standard reference for data governance frameworks |
Micro Signal
Lynch Lens: The key micro-metric is “data integration rate” — what percentage of an operator’s data sources are connected into a single analytics platform? For most Australian rail maintainers, this number is below 30%, per IBM Institute for Business Value transport benchmarks. Every percentage point improvement unlocks new cross-domain insights (e.g., correlating weather data with track defect rates). The operators who reach 80%+ integration will have an analytical competitive advantage their competitors cannot easily replicate — what Michael Porter would call a barrier to entry.
Macro Signal
Druckenmiller Lens: The macro pattern from Day 15: data and analytics are the emerging structural advantage in Australian rail. The industry sits on decades of underutilised data, and the operators who build data integration and predictive analytics capabilities first will lock in a competitive advantage that compounds over time — a first-mover advantage in an industry with high switching costs. As Infrastructure Australia pushes for evidence-based investment decisions and the National Transport Commission sets data-sharing frameworks, operators with superior data capabilities will attract disproportionate funding and partnership opportunities over the next decade.
Sources
| Type | Source |
|---|---|
| IBM | IBM watsonx — “Enterprise AI for Industry” |
| IBM | IBM Cloud Pak for Data — “Data Fabric for Rail Operations” |
| IBM | IBM watsonx.data — “Open Data Lakehouse for AI” |
| IBM | IBM Institute for Business Value — “Data-Driven Operations in Transportation” (2024) |
| Industry | Australasian Railway Association — “Digital Rail Transformation Roadmap” |
| Regulator | Office of the National Rail Safety Regulator (ONRSR) — Rail safety standards and compliance frameworks |
| Standards | RISSB — Rail Industry Safety and Standards Board — AS 7636 and data standards |
| Government | National Transport Commission — Data-sharing frameworks for Australian transport |
| Government | Infrastructure Australia — Evidence-based infrastructure investment priorities |
| Research | McKinsey & Company — “Advanced Analytics in Transport: From Data to Decisions” (2024) |
| Government | BITRE — “Australian Rail Statistics Yearbook 2024” |
| Government | Bureau of Meteorology — Weather data feeds for track condition correlation |
| Standards | ISO 55001 — Asset Management Systems — Requirements |
| Standards | ISO 8000 — Data Quality Management |
| Framework | DAMA-DMBOK — Data Management Body of Knowledge — governance framework |
Next: The Green Locomotive Paradox · Remember when trains were the dirtiest thing in the landscape? Here’s the paradox: they were always the cleanest way to move freight — and almost nobody knew.